
CAN Monitor Window
This window is created by doing Window… New CAN Monitor (Ctrl-R).
It allows you to view and log all activity on each CAN bus.
Note: see also the specialised ISO 15765-2 and J1939 windows if you wish to view messages encoded via those transport protocols, and also the CAN Sender window to transmit messages.
Viewing Messages by Bus and ID
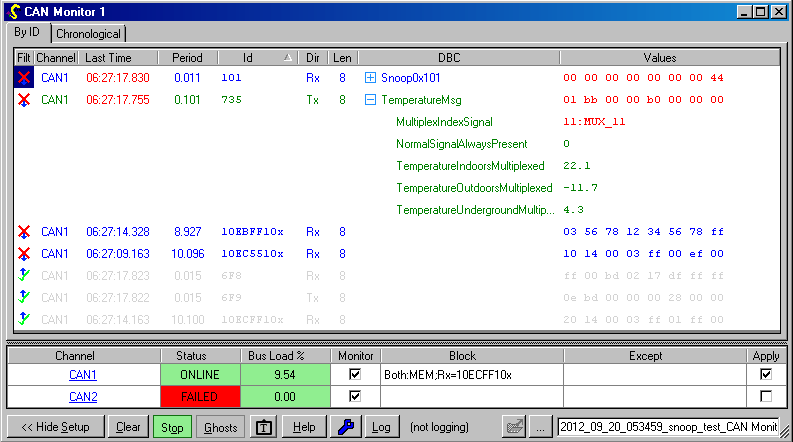
This view (with the By ID tab selected) shows a single row for each CAN ID which has been received so far. The most recent data bytes are shown. This view is useful for observing which message IDs are in use and their periodic rates.
Note: here the CAN bus settings are also shown. They can be hidden using the Hide Setup button.
You may click the column headings to sort the messages by bus, ID, etc. Any new message is added to the bottom of the list when it is first received.
The ‘DBC’ column is filled for any messages recognised from the loaded DBC files. See also DBC Setup help. You may expand such messages so that the numeric value for each signal is displayed. Multiplexed signals are handled.
The last absolute time each message is received is shown, and the interval between successive messages (in seconds) where more than one has been received.
A CAN ID suffixed with an “x” (e.g. 1234x) was sent in extended (29-bit) format. Both CAN IDs and data are shown in hexadecimal.
Messages transmitted by the PC are shown in green, and those received in blue. Data that has just changed is shown in red.
You may drag and drop a message or individual signal to a Watch window for logging, viewing and graphing alongside internal ECU parameters.
Message Filtering
You may control which messages are “allowed through” for message logging and chronological display (below). The hardware interface is still set up to receive all messages, so you may apply different blocking rules in different CAN Monitor windows.
![]()
To block or unblock specific messages, click the button in the Filt column. Messages which are blocked are shown as “ghosts”in grey in the by-ID message list by default. However, you can hide them completely by pressing the ‘Ghosts‘button.
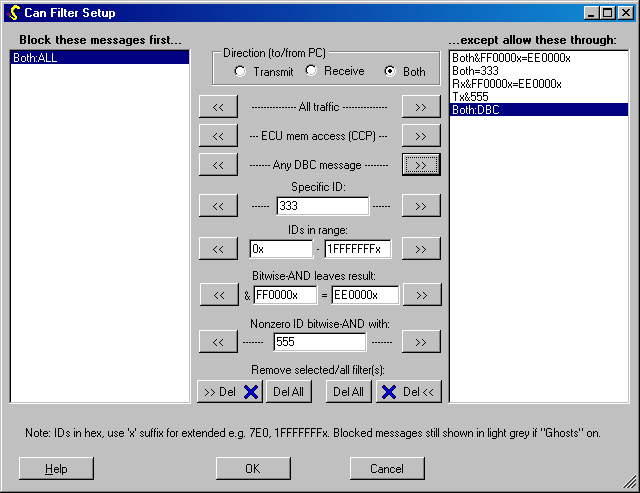
For advanced filtering rules, click in the Block or Except area for the hardware channel, which brings up the window shown below. Messages can be blocked or allowed through according to various criteria:
- Received by PC, sent by PC, or both
- Memory access traffic (e.g. CCP)
- Message is defined in a DBC file loaded for channel
- Message is a CAN error frame
- Specific CAN ID
- Range of CAN IDs
- CAN ID matching a bitmask (ID AND mask leaves specified value)
- CAN ID matching a bitmask (ID AND mask leaves any bits set)
A bitwise mask can be useful for filtering J1939 messages, for example:
- ID & 00FF0000x extracts the PF field but ignores the priority, SA, and PS/DA fields (find particular PDU1 PGN e.g. address claim will leave 00EE0000x)
- ID & 000000FFx extracts only the SA field (packets sent from particular node only)
- ID & 0000FF00x extracts only the PS/DA field (packets sent to particular node only)
Viewing Messages Chronologically
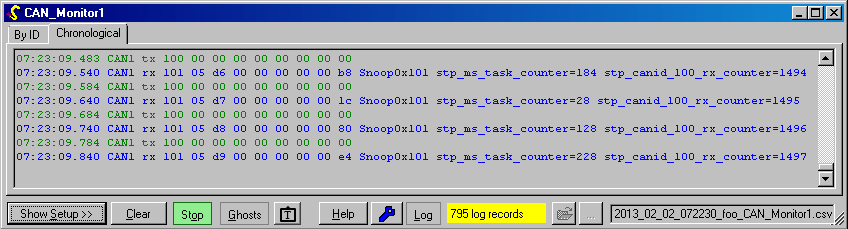
This view (with the Chronological tab selected) shows each message received listed in the order in which they were received. This is useful for understanding an exchange of CAN messages between different nodes.
DBC messages and individual signal values are shown by default, but can be optionally hidden to reduce clutter by clicking the settings (spanner/wrench) button.
Note: here the CAN bus settings are hidden to save space. They can be shown again using the Show Setup button.
Very rapid bus traffic cannot all be displayed; a warning is shown if this is the case. However, all messages are captured to the logfile if logging is in progress (see below).
Messages transmitted by the PC are shown in green, and those received in blue.
Channel Settings

The list of channels is built automatically from the CAN buses you have defined (see Hardware window).
The approximate loading for each bus is shown in the Bus Load % column.
If the Monitor checkbox for a channel is unticked, no messages will be shown for that channel.
The Block and Except settings store the current filter setup for the channel (see above). Click on these to change the filtering.
The current filters for a channel can be disabled by unticking the Apply box.
Controls and Logging

The Show/Hide Setup button controls the display of the channel settings as shown in the examples above.
Clear removes all messages currently shown in both the By ID and Chronological views. This helps if you wish to see only the currently active CAN messages, and not those that have not been sent recently.
The coloured Stop/Go button can be used to stop monitoring all channels, or resume. This can be useful if you have just observed some behaviour and wish to look at recent messages before they are replaced by newer ones.
The “text camera” button copies all data shown to the clipboard as text, so that it can be pasted into other programs. By default the channel information (lower pane) is not copied, but go into the settings to change this.
The Log button writes a file for every message captured. The filename is specified by using the browse (…) button. Two file formats are available:
- a .csv (comma separated variable) format file is generated by default which can be immediately opened in Microsoft Excel using the file open (folder) button. Note: use the HEX2DEC function in Excel to convert hexadecimal values to decimal;
- .asc format (space delimited text) can also be selected.
Note: messages which are blocked by filtering (shown as ghosts) will not be included in the log file.
Use the spanner (wrench) button for more logging options. By default, logging in .csv format will include the values of all individual signals if a message is defined by a DBC file associated with the channel. Logfiles with such signals may be opened in a Watch window for graphical analysis.
The window can be scaled or maximised as required.
 Accessibility