Watch/Oscilloscope Window
This window is created by doing Window… New Watch/Scope Window (Ctrl-W). It can be used with or without an oscilloscope-style live graphical view of the data, as shown below.
Watch windows are used to display variable or parameter values by name, similarly to the watch windows in software debuggers. Each row in the watch window can display one value. Structures and arrays require a row per element; these types can be expanded or collapsed as required. Similarly pointer types can be followed to a certain depth. Bitfields are supported.
If multiple ECUs are defined, names are automatically prefixed with the ECU name so that variables of the same name can be accessed in different ECUs simultaneously, e.g. ECU1:second_counter. The ECU prefixes can be hidden (File… Preferences).
To display 1D or 2D arrays, consider also lookup windows.
To use:
- A hardware channel must be active.
- Ensure that symbols are loaded from the ECU linker file.
- Click on the Symbols… button to browse for variables to add to the watch window. You may select many variables at once.
- Alternatively, you may type variable names directly into the Name column (or copy and paste them from your code editor).
- DBC-defined CAN signals can be watched directly without any ECU symbols loaded.
The list of variables in the watch window is stored as part of the saved workspace.
See Understanding Memory to understand the colour coding of values (live, file or edited). The raw memory locations covered by a variable can be instantly displayed in a Memory Explorer window by clicking on the value in the Address column.
If live values are not shown, check that the hardware interface for the ECU is Activated (try Deactivate and Reactivate if necessary).
Watch with Scope
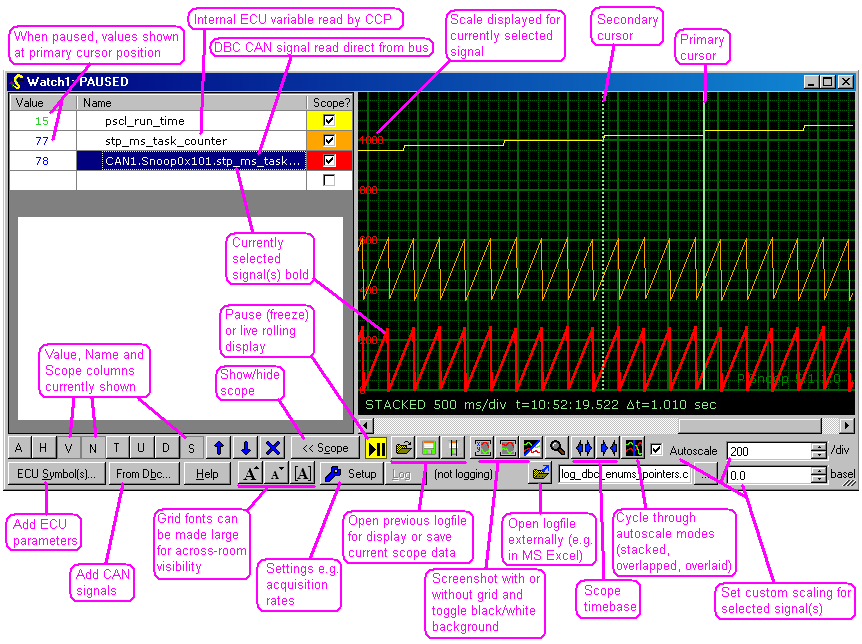
The scope view is useful for watching system and fast-changing behaviour. By default, fewer data columns are displayed when the scope is shown, but those that are hidden may be added if desired.
Use a left button mouse click to position the primary cursor, and a right click to position the secondary cursor. Hover over a datapoint (not connecting line) to see the parameter name, time, and value exactly.
Note: using the scope significantly increases communications bandwidth and ECU load. To trade off fidelity against resources, adjust the acquisition rate using the Setup button (see below). If acquisition is too slow, aliasing may result, giving “unexpected” waveforms, so the default rate is quite fast. Some setup options are provided to improve bandwidth utilisation.
Watch without Scope
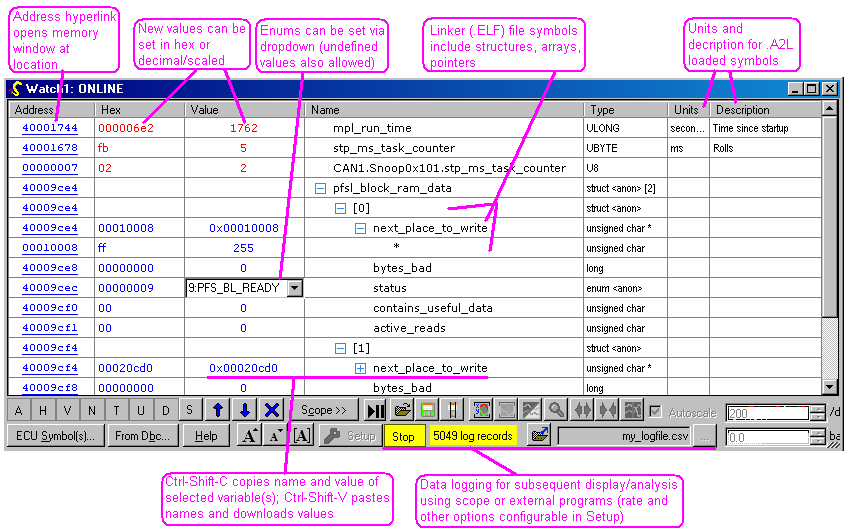
Without the scope, more columns are displayed by default. This view uses litte communications bandwidth and is aimed at software debugging.
Editing a value (as hex or decimal/enumeration) will cause OpenECU Calibrator to attempt to download that new value if communications are enabled. Otherwise PC memory is edited.
Enum values can be set using a label, decimal or hex value, or using the drop-down list which appears if the mouse is moved over the value for that row. Pointer values can be entered as &name or as hex or decimal.
Right-click on a row to show further options and actions.
Use the AHVNTUD buttons to show or hide columns. For example, you may want to see only the variable names and raw hex values, in which case select only N and H. The columns all start visible.
Units and Description will be empty unless you have loaded symbols from an ASAP2 file (see ECU help).
The “text camera” button (not shown above) copies all data shown to the clipboard as text, so that it can be pasted into other programs.
Data Logging
Clicking the Log button will cause OpenECU Calibrator to continually save the values of all variables listed in the window to disk. A .csv (comma separated variable) format is used with timestamps tabulated against values. Click the Setup button for more options, in particular to set the data acquisition rate.
The .csv logfile format can be re-opened in this program, in an existing or new Watch window (File… Open Logfile in new Watch/Scope), with a graph automatically displayed using the oscilloscope view.
Alternatively, click the “open externally” button to launch whatever program you have associated with .csv files (e.g. Microsoft Excel). The data is structured so that the Excel Chart wizard can be directly used to display it as a Scatter plot.
Controls Toolbar
You can also nudge values or control logging by using the buttons on the controls toolbar. (Windows… Controls Toolbar to display it if it is not currently shown.) This toolbar may be dragged near the window you are working with:

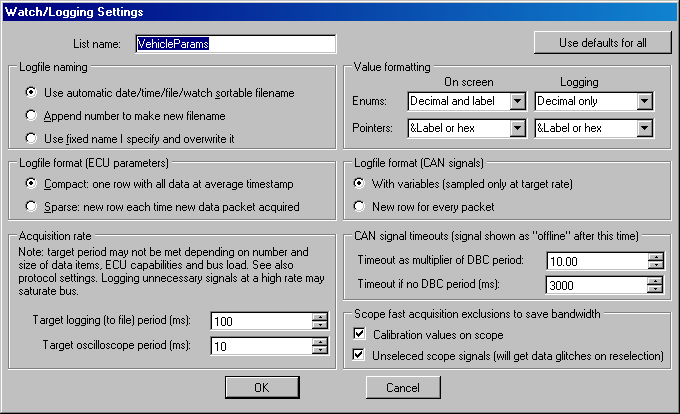
Setup
Click on the Setup button with a spanner (wrench) to adjust the settings shown below:
 Accessibility